Mitochondria the powerhouse of a cell has important roles to play in cellular bioenergetics. Mitochondrial function is altered in diseases like cancer, neuro-degenerative disorders, muscular dystrophies, Alzheimer, and other diseases. Mitochondria is central to energy metabolism supplying ATP to all cellular physiological processes, maintaining cellular redox homeostasis, and regulating programmed cell death or apoptosis via mitochondrial pathway. Since, the interplay of glycolysis and mitochondrial OXPHOS is altered in cancer, mitochondria have become a target of therapeutic intervention. At the Periasamy Lab we study cellular metabolism and mitochondrial response to treatment in cancer, diabetes, Alzheimer disease (AD), etc., by advanced fluorescence and lifetime imaging microscopy (FLIM). We also developed a technique to calculate the redox ratio without any optical artifacts called “Fluorescence Lifetime Redox Ratio (FLIRR).
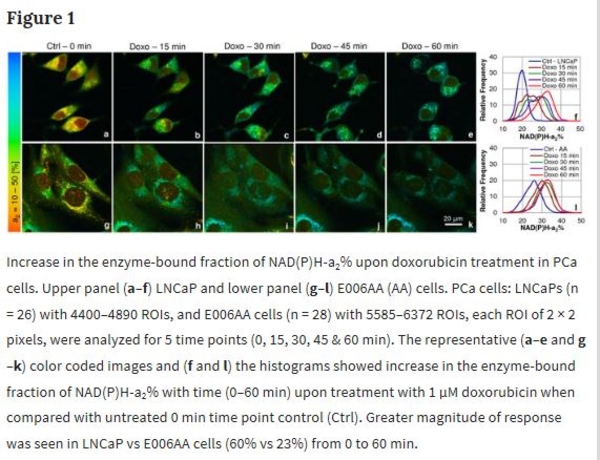
Prostate cancer (PCa) is one of the leading cancers in men in the USA. Lack of experimental tools that predict therapy response is one of the limitations of current therapeutic regimens. Mitochondrial dysfunctions including defective oxidative phosphorylation (OXPHOS) in cancer inhibit apoptosis by modulating ROS production and cellular signaling. Thus, correction of mitochondrial dysfunction and induction of apoptosis are promising strategies in cancer treatment. We have used Fluorescence Lifetime Imaging Microscopy (FLIM) to quantify mitochondrial metabolic response in PCa cells by tracking auto-fluorescent NAD(P)H, FAD and tryptophan (Trp) lifetimes and their enzyme-bound fractions as markers, before and after treatment with anti-cancer drug doxorubicin. A 3-channel FLIM assay and quantitative analysis of these markers for cellular metabolism show in response to doxorubicin, NAD(P)H mean fluorescence lifetime (τm) and enzyme-bound (a2%) fraction increased, FAD enzyme-bound (a1%) fraction was decreased, NAD(P)H-a2%/FAD-a1% FLIM-based redox ratio and ROS increased, followed by induction of apoptosis. For the first time, a FRET assay in PCa cells shows Trp-quenching due to Trp-NAD(P)H interactions, correlating energy transfer efficiencies (E%) vs NAD(P)H-a2%/FAD-a1% as sensitive parameters in predicting drug response. Applying this FLIM assay as early predictor of drug response would meet one of the important goals in cancer treatment.
**************************************************************************************************************************************
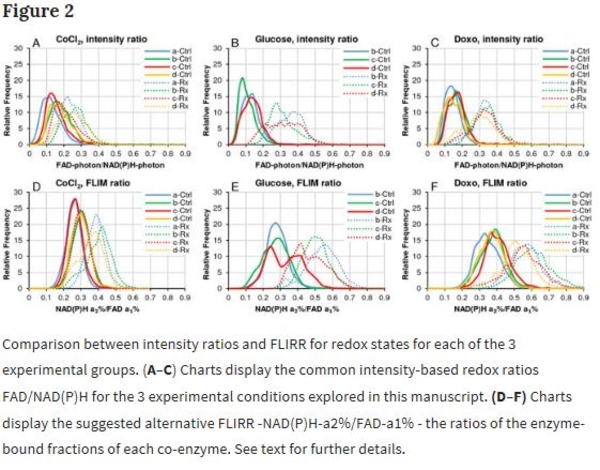
Multiphoton FLIM microscopy offers many opportunities to investigate processes in live cells, tissue and animal model systems. For redox measurements, FLIM data is mostly published by cell mean values and intensity-based redox ratios. Our method is based entirely on FLIM parameters generated by 3-detector time domain microscopy capturing autofluorescent signals of NAD(P)H, FAD and novel FLIM-FRET application of Tryptophan and NAD(P)H-a2%/FAD-a1% redox ratio. Furthermore, image data is analyzed in segmented cells thresholded by 2 × 2 pixel Regions of Interest (ROIs) to separate mitochondrial oxidative phosphorylation from cytosolic glycolysis in a prostate cancer cell line. Hundreds of data points allow demonstration of heterogeneity in response to intervention, identity of cell responders to treatment, creating thereby different sub-populations. Histograms and bar charts visualize differences between cells, analyzing whole cell versus mitochondrial morphology data, all based on discrete ROIs. This assay method allows to detect subtle differences in cellular and tissue responses, suggesting an advancement over means-based analyses.
**************************************************************************************************************************************

**************************************************************************************************************************************
Characterization of mitochondrial dysfunction due to laser damage by 2-photon FLIM microscopy


Mitochondria are the central organelles in cellular bio-energetics with key roles to play in energy metabolism and cell fate decisions. Infra-red femto-second pulsed lasers are widely used in fluorescence lifetime imaging of metabolic co-enzymes to understand cellular metabolism in normal and disease states. At higher power levels, the laser can induce phototoxic effects.
We investigated this very important question, whether the FLIM 2p-laser can damage mitochondria and if so, at what mW levels? Acquisition time of course is a companion variable and is usually the preferred way to avoid phototoxic cellular damage by increasing acquisition time and simultaneously reducing laser power levels. The challenge however remains to separate pharmacological interventions during imaging from laser induced and instrument related deleterious effects.
We have characterized two photon (2p) laser induced changes at the intra-cellular level, specifically in the mitochondria, where damage was assessed at rising 2p laser average power excitation. Our results show that NAD(P)H-a2% - the lifetime-based enzyme bound fraction, an indicator of mitochondrial OXPHOS activity is increased by rising average power, while inducing changes in the mitochondria at higher power levels, quantified by different probes like the Mito Tracker CMXRos (Figure 1, Alam et al., Sci Rep 2022). Treatment response tracked by means of NAD(P)H-a2% (Alam et al., Sci Rep, 2017) can be confounded by laser-induced damage producing the same effect. Our study demonstrates that 2p-laser power optimization is critical by characterizing changes in the mitochondria at increasing laser average power.