Balance Sheet
 One measure of an institution's financial health is whether or not expendable fund balances are growing at a rate equal to or greater than the growth in expenditures. For the University, expendable fund balances primarily consist of the current funds and the quasi-endowment funds. The University's net assets in these funds can be more readily converted into cash than the equity in the nonexpendable funds, such as investment in plant and true endowment funds.
The information presented in Figure 1 represents solid performance. Over the four-year period, June 30, 1991 to June 30, 1995, the University's expendable balances exceeded the growth in expenditures, with the current year's performance representing the highest percentage for the period. The University has been successful at both controlling the growth in expenditures and increasing its expendable fund balances, notably the quasi-endowment and unrestricted current funds. Overall, expendable fund balances increased 52 percent, while expenditures have increased only 23 percent since 1991.

 Current Operations
A critical question for any organization is whether revenues exceed expenditures. If they do not, the organization will be unable to retain a portion of revenues for use in future years, when needs may exceed resources.
Figure 2 shows the net revenues as a percentage of total revenues for the University's operating segments, measuring the degree by which revenues exceed expenditures. On a consolidated basis, the University's revenues exceeded expenditures during the year by 5 percent, a significant improvement over 1994. The three operating units of the University, educational and general, auxiliary enterprises, and the Medical Center, experienced increases in their percentages for 1995 when compared to 1994.
The educational and general segment reversed a three-year downward trend with a significant increase in net revenues for 1995. The reversal in 1995 was accomplished despite a decrease in state appropriations totaling 7.5 percent since 1991. Compared to 1994, the University's educational and general revenues increased 6 percent, while expenditure growth was held to 5.1 percent. The 1995 performance was accomplished with a 5.6 percent increase in tuition and fees revenue, unlike the recent double digit increases, and despite only a 0.9 percent increase in state appropriations.
The Medical Center also experienced a positive year, with a 5.2 percent net revenue percentage. The remarkable rebound from 1994 was the result of a successful effort to contain costs. While Medical Center revenues increased 2.6 percent, expenditures actually decreased by 0.6 percent from 1994.
The auxiliary enterprises experienced a slight increase in the net revenue percentage from last year, and the combined percentage of net revenues stands at 15 percent. When evaluating the results for the auxiliary enterprises, it must be noted that the percentages do not reflect all expenditures related to the replacement of equipment and renovation of facilities. Such expenditures, which are a significant component of their operations, are generally recorded in reserve accounts that are not included in the current funds. Also note that the auxiliaries are required to generate all revenues through user charges and, therefore, do not receive state appropriations.
Credit Worthiness
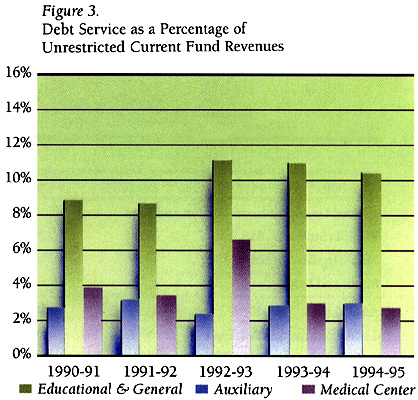
Another equally important financial indicator is the University's ability to satisfy obligations from current revenues. Just as the University is expected to fund operations from current revenues, it must also repay its borrowings from these revenues. The University continues to maintain a positive relationship between annual debt service requirements and unrestricted revenues. Overall, the University's debt service was  3.4 percent of unrestricted revenues for fiscal year 1995, unchanged from 1994. This particular measure (where lower percentages are desirable) is most significant when analyzed for each separate unit, as shown in Figure 3, since debt issued for each operational unit should be repaid from resources generated by that unit.
Despite the wide variance in debt service percentages, each segment's measure is well within acceptable guidelines. Both the Medical Center and auxiliary enterprises showed improvements from 1994. The amount of debt service for those two units remained unchanged, while net revenues increased during fiscal year 1995. The educational and general unit's percentage increased from 1994 because of the additional debt service for planned new buildings and the Commonwealth's equipment trust fund program.
Endowment Funds
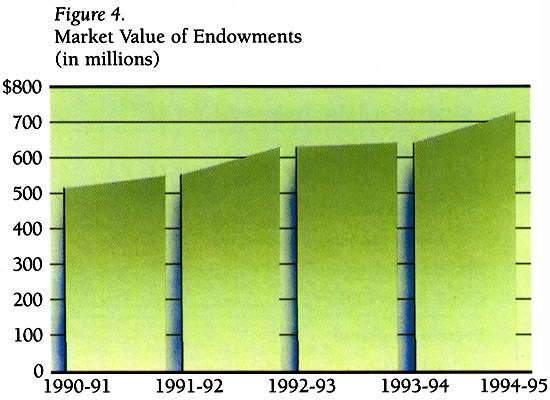
The University's endowment totaled $730 million, as of June 30, 1995. It consistently ranks among the thirty largest endowments for colleges and universities and among the five largest for public institutions, according to the NACUBO Endowment Study. During 1995 (Figure 4), the endowment grew by $89 million. Of this amount, $80 million is attributable to investment appreciation and $14 million to gifts, while net transfers out of the endowment totaled $5 million. Over the five-year period since June 30, 1991, the market value of the endowment has grown by $222 million.
 In managing its endowment, the University must balance the competing objectives of providing income to meet the needs of the current University community and providing growth in the underlying assets, so that the endowment will provide the same level of support in inflation-adjusted dollars to the University in the future. In order to satisfy these dual objectives, the Growth and Income Fund, the University's main endowment fund with assets totaling $572 million, sets its distribution rate at approximately 4 percent of the market value of the fund at the beginning of the fiscal year. The remainder of the return is left in the fund to preserve the endowment's future purchasing power. The Balanced Fund, with assets totaling $105 million, is invested for a higher yield, 6 percent, as income earned on these funds is eligible for a state supplement as expended. The remaining $53 million represents separately managed endowments, including investments with limited marketability or donor restrictions and funds whose purposes are inconsistent with the pooled funds. Not included in the endowment controlled by the University are assets held in trust for the benefit of the University and endowments held by the University's related foundations.
For 1995, the Growth and Income Fund distributed $24 million, and the Balanced Fund distributed $5 million. The use of endowment income may be restricted to a specific purpose by the donor, or it may be unrestricted and directed at the Board's discretion. As of June 30, 1995, 68 percent of the total endowment was restricted and 32 percent was unrestricted.
Medical Center
The financial results from fiscal year 1995 improved over the previous year. The Medical Center's excess of revenues over expenses from operations was $22 million, representing 5.6 percent of the total revenue for 1994-95. Total revenue of $394 million for fiscal year 1995 exceeded last year's total revenue of $387 million by 1.8 percent. Non-operating gains of $3.3 million for fiscal year 1995 were greater than the previous year's by $0.9 million. The Medical Center provided 170,635 days of patient care, 3.5 percent less than in the previous year. This decline resulted from the reduction in the length of time patients stay in the hospital. During fiscal year 1995, the length of stay declined by 3 percent from 6.6 days to 6.4 days. There was less than a 1 percent decrease in the number of patients admitted in 1994-95 to 27,116, and the number of clinic and emergency visits increased to 447,364, 12.5 percent higher than in fiscal year 1994.
To remain competitive in the health care market, management continues its efforts to improve patient services and to reduce the costs of those services. These efforts have allowed the Medical Center to maintain a stable volume of inpatient admissions, increase its outpatient volume, and reduce expenses from $372.3 million to $371.8 million.
